Digital transformations and Big Data
 Todays Prof. Rowan took us into the world of digital data, it's usefulness as a resource and some
 ways of displaying it creatively, as well as it's potential for bias and corruption.
Pre-lecture we watched a video on Aaron Swartz (The hacker of Jstore)
Big data = the collection of information from multiple databases. (a sophisticated archive?)
Datafication = processing the data to analyse it
We are constantly creating data in this digital age, from social media accounts Twitter, Facebook etc, where our information on likes and dislikes can be gathered and sold to marketeers, datafication of moods and relationships... or used to predict trends; to CCTV and GPS which could be used for security, crime solution or easier navigation.
We explored cultural differences between modes of social media interactions (chinese audio messaging app) How can we analyse diferent social media tools? how are they used? Why? What gratification do people get back from them? Connectivity, Speed of information etc
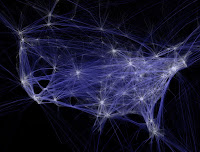
Then Finally we looked at the Visualisation of data. The idea that complex numbers can have more impact when viewed in a creative way... not just pie charts but really eyecatching art awareness pieces like Chris Jordans "over the Moon" and Aaron Koblins flight paths.
The challenge is how to present data in interesting ways? (one million tweet map or ngram viewer)
Telling stories with data. animations, 3D infographics etc
- Perhaps I could use AR to project data as part of a dresses Constuction? Overlaying information on the 3 dimensional form... fashion analasis of design trends and predictions...or amount of waste created by fashion industry...
Books to Read
"The informational city" Manuel Castells and Yuko Aoyama
"City of Bits" WJ Mitchell
"The Cyborg manifesto"


Comments
Post a Comment